|
|
|
|
|
|
|
This month, we feature tips for some tasks which have been requested recently by Math Illustrations users. - Inequalities
- Number line
- Normal distribution
|
 Inequalities
[Video] Inequalities
[Video]
Math
Illustrations supports shaded polygons (with straight or curved sides).
Diagrams involving inequalities can be created using polygons, and then
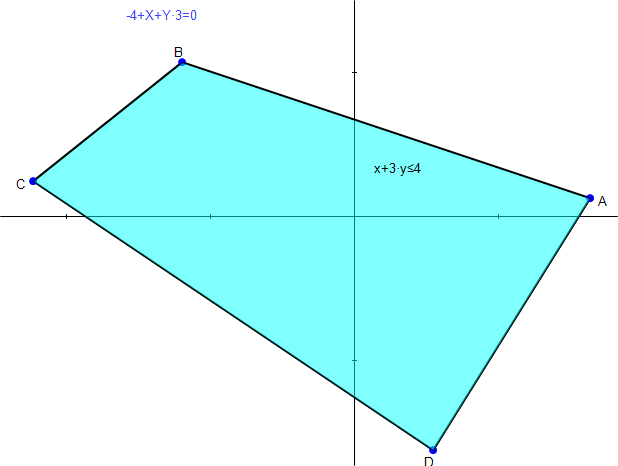
capturing a portion of the polygon. For example, to create a picture of the inequality x+3y<=4, do the following - Sketch four line segments to form a quadrilateral.
- Select one side, and set its equation to be x+3*y=4.
- Select the four sides and Construct/Polygon.
- Select the polygon and Properties from the right-click menu.
- Set the fill color and pattern as desired.
- Use Annotate/Expression to add the inequality definition.
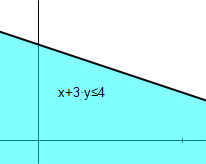
- When you use Edit/Copy Region, select a region which contains only the edge of the quadrilateral representing x+3*y=4.
As polygons can have edges which are arcs, you can display non-linear inequalities.
|
| |
 Number Line
[Video] Number Line
[Video]
Math
illustrations does not have a number line object as such. However
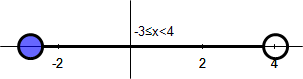
it's easy to create one, here's how to create a two sided inequality:
- Select the y axis, right click Axis Properties/Show Labels/No
- Create a circle or two circles for the ends of the inequality
- Specify the radius of each to be r, and drag till they are appropriate sizes.
- Select the circle and set Properties/Fill Style to solid for a closed interval, and none for an open interval
- Draw a line segment between the intersections of the circles with the x-axis.
- Hide all unnecessary points and constraints.
- Use Annotate/Expression to create the inequality label.
To diagram a one sided inequality, proceed as above, but use
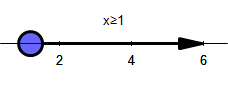
only one circle.
Select the segment and use Right Click/ Arrow Heads to add an arrow to the number line.
|
| |
 Normal Distribution
[Video] Normal Distribution
[Video]
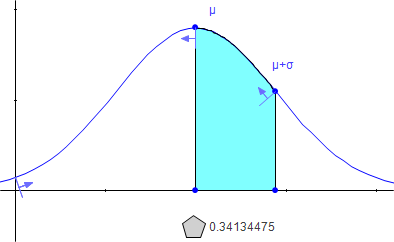
Can you draw a normal distribution in Math Illustrations? The answer is emphatically yes.
And the distribution can have generic mean and standard deviation,
which can be varied from the variables panel or by dragging the curve. What's more, the area under a curve feature can be used to illustrate important properties of the distribution. The easiest way to create a normal distribution is simply to download the file from the online
image gallery- Use View/Tool Panels/Variables to display the variables panel which lets you alter the mean and standard deviation.
- If you grab the curve near the top of the bell and drag up and down, you will find that you are altering the standard deviation.
- If you grab the curve at the side of the bell and drag left and right, you will find you are altering the mean.
Create an area under the curve as follows: - Draw an arc on the curve.
- Select each end of the arc along with the curve and use Constrain/Proportional to set the endpoint's x location (try, for example, mu and mu+sigma).
- Select the arc and do Construct/Area under Arc.
- Select the resulting polygon and measure its area.
|
| |
|
|
|