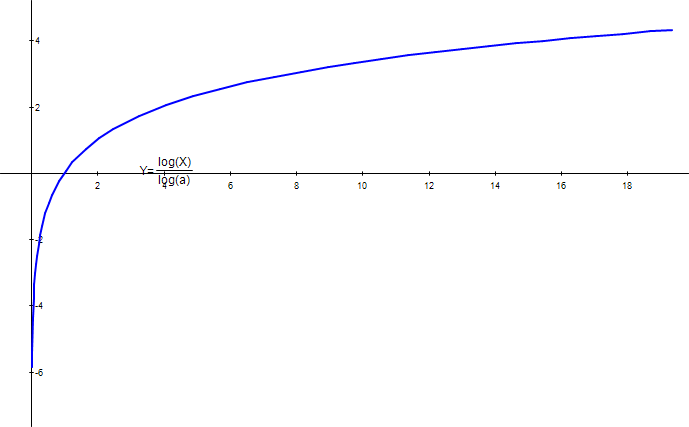
Drag the graph to adjust it. When you click on it, a small circle with a variable next to it should appear. Drag that circle to adjust that variable.